Waters Corporation, Milford, MA, USA
In order to ensure product quality, meet regulatory requirements and maintain the company's most valuable asset – brand image, vegetable oil companies monitor the production process of vegetable oil from raw materials to finished products. Currently, vegetable oil analysis relies mainly on gas chromatography (GC) and high performance liquid chromatography (HPLC). Gas chromatography requires derivatization prior to analysis, which is both time consuming and laborious 2 . In order to achieve complete separation, conventional high performance liquid chromatography requires the use of a halogenated solvent or the use of a non-halogenated solvent 3-6 which will last longer. The use of halogenated solvents has been limited in most laboratories since halogenated solvents have been recognized to be carcinogenic. Therefore, there is an increasing demand for analytical tools that are more effective for quality control and quality identification of vegetable oils.
The ACQUITY UPLC® system is the next generation LC platform. UPLC®/PDA/ELSD/MS detectors allow for faster screening and high resolution methods for the characterization of vegetable oils without the use of halogenated solvents 7-10. Ultra-high performance liquid chromatography (UPLC) systems provide multiple types of data in a single injection, producing reproducible fingerprint data, identifying triglyceride components, and assessing the degree of oxidation and decomposition of vegetable oils. Compared to conventional high performance liquid chromatography, ultra-high performance liquid chromatography reduces analysis time, reduces solvent usage, and provides chromatograms with higher resolution and more information from one injection. Therefore, ultra-high performance liquid chromatography is more cost effective. This technical document describes a more efficient system solution for quality control and quality identification of vegetable oils, using the user-defined field calculations of UPLC and EmpowerTM 2 software to automatically quantify and report whether plant oil samples meet user-defined settings. Quality control standards. This solution eliminates the need for manual calculations, avoiding possible human error and reporting critical information quickly and accurately. With accurate and timely results, decision makers can improve delivery efficiency and yield, ie reduce non-conforming products, avoid product recalls, and minimize liability litigation. The experimental section of this article provides examples of custom field calculations with detailed steps.
experiment
Sample preparation:
Edible oil, purchased from a local grocery store. The edible oil sample was diluted to a 6 mg/ml solution with 2-propanol for analysis.
Ultra high performance liquid chromatography conditions:
Ultra Performance LC System: ACQUITY UPLC, PDA Detector Software: Empower 2
PDA parameters:
Detection wavelength: 195-300nm
Sample rate: 20 pts/s
Filter response speed: fast
Ultra-high performance liquid chromatography parameters:
Column: ACQUITY BEH C18 2.1 x 150 mm
Weak elution: 2-propanol (each elution amount: 500 μL)
Strong elution: 2-propanol (each elution amount: 500 μL)
Filling and elution: 10% aqueous CH3CN solution (every 5 minutes)
Mobile phase A: CH3CN
Mobile phase B: 2-propanol column temperature: 30 ° C
Injection volume: 2 μL (full loop quantitative)
Gradient conditions:
Time (min) flow rate (mL/min) %B curve
0 0.15 10 —
22 0.15 90 6
Balance column and UPLC system conditions:
Time (min) Flow rate (mL/min) %B Curve 0 0.13 100 —
18 0.13 10 11
21.5 0.7 10 11
24.5 0.15 10 11
25 0.15 10 11
Note: Prior to running the sample set, a blank sample of 2-propanol was advanced; this value was used as a blank deduction for the PDA 3D spectrum.
1. If the indicated peak 3O (peak area OOL/marked peak area) is >0.84 or <0.86, it is qualified; otherwise it is unqualified.
3. If the indicated peak LLO (peak area LLO / marked peak area) > 0.39 or < 0.41, it is qualified; otherwise it is unqualified.
4. If the indicated peak LLL (peak area LLL/marked peak area) is >0.039 or <0.045, it is qualified; otherwise it is unqualified.
5. If the impurity peak (impurity peak area/marked peak area) is <0.42, it is qualified; otherwise it is unqualified.
Create step 11 to calculate the peak area ratio than the custom field:
1. Click on “Configure System†to enter the configuration manager; click on “Project†in the tree structure.
2. Select and right click on the desired item.
3. Select Properties to open the Project Properties window.
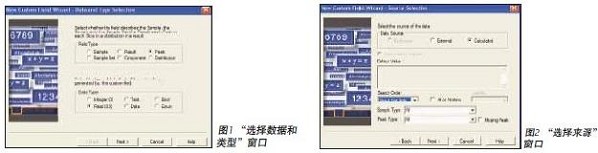
4. Click on the "Custom Fields" tab; then click on "New" to open the "Data and Type Selection" window (Figure 1).
5. Select “Peak†in the field type, select “Real (0.0)†in the data type; then click “Next†to open the “Select Source†window, as shown in Figure 2.
6. Select "Calculate" in "Data Source", select "All" in "Sample Type" and "Peak Type"; select "Limit to Result Group" in "Search Order", and then click OK in the pop-up window. "Do not check "All or No" and "Loss Peak" options; click "Next" to open the "Enter Formula" window, as shown in Figure 3.
7. Enter Area/IS [Area] into the field; click "Next" to open the "Numeric Parameters" window (using the default value).
8. Click "Next" to open the "Enter Name" window.
9. Enter a new field name (for example, the field name used here is "Ratio _IS"); select "Project" in "Create this field".
10. Click on “Finish†and a custom field called “Ratio_IS†is created to calculate the peak area ratio, as shown in Figure 4.

1. Click "Configure System" to open the configuration manager; click "Project" in the tree structure.
2. Select and right click on the selected work item.
3. Select Properties to open the Project Properties window.
4. Click on the "Custom Fields" tab; then click on "New" to open the "Data and Type Selection" window, as shown in Figure 1.
5. Select "Peak" in the field type, select "Boolean (0.0)" in the data type; then click "Next" to open the "Select Source" window.
6. Select "Calculate" in "Data Source", select "All" in "Sample Type" and "Peak Type"; select "Limit to Result Group" in "Search Order", and then click "In the pop-up window" OK"; select the "all or nothing" option, click "Yes" in the pop-up window; then click "Next" to open the "Enter Formula" window.
7. Enter the following formula into the field:
GTE (3O[Ratio_IS], 0.841)
9. Next to “0â€, enter “Failedâ€; next to “1â€, enter “Qualifiedâ€; then click “Next†to open the “Enter Name†window.
10. Enter a name (for example, "Oly_OOO" is used here); select "Project" in "Create this field".
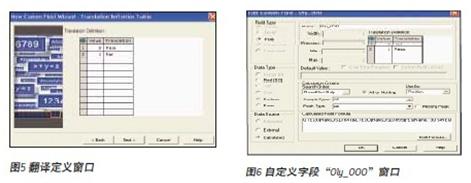
11. Click “Finishâ€, which creates a custom field called “Oly_OOO†to verify that the peak area ratio (OOO peak area divided by the marked peak area) meets the quality control criteria for the indicated peak OOO, as shown in Figure 6. Shown. Repeat steps 1-8 to determine if the remaining indicator peaks are qualified: For the indicated peak OOL, in step 4, enter the following formula in the Input Formula window:
GTE (OOL [Ratio_IS], 1.18)
For impurity indication peaks, in step 4, enter the following formula in the Input Formula window:
GT (Impurity[Ratio_IS], 0.42)*EQ(Name, "Impurity")+NEQ(Name, "Impurity")*-1*50000. In step 7, enter "Oly_Impurity" in the field name to create the field. “Oly_ Impurity†to verify that the peak area ratio (the impurity peak area divided by the marked peak area) meets the quality control criteria.
This method uses the timing group function to calculate the sum of impurity peaks:
1. In the Edit Processing Method window, select the Timing Groups tab, as shown in Figure 7.
2. Enter the impurity name in the Name field, enter 3 in the Start Time field, and enter 13.6 in the End Time field.
3. Check the "Do not include known peaks" field. Mark the selected marker peaks and indicator peaks in the processing method:
1. Select the "Components" tab in the "Edit Processing Method" window.
2. Change the name of the peak with a retention time of 9.81 min to IS and enter the labeled peak in the Peak Label field, as shown in Figure 8.
3. Change the name of the peak with a retention time of 13.79 min to 3L and enter "LLL" in the "Peak Label" field.
4. Change the peak name with a retention time of 14.85 min to 2LO and enter "LLO" in the Peak Label field.
5. Change the peak name with a retention time of 15.87 min to 2OL and enter "OOL" in the Peak Label field.
6. Change the name of the peak with a retention time of 16.85 min to OOO and enter "OOO" in the Peak Label field.


Steps to create a named group in the processing method:
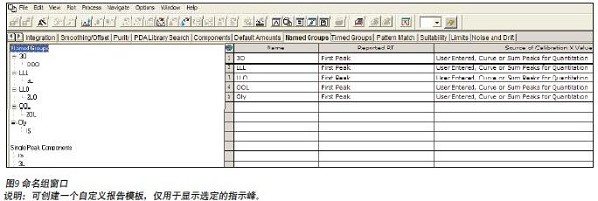
1. Select the Named Groups tab in the Edit Processing Method window.
2. Enter 3O, LLL, LLO, OOL, and Oly in the Name field, as shown in Figure 9.
3. Drag the OOO, 3L, 2LO, 2OL, and IS from the “single peak component†to their respective named groups, as shown in Figure 9. Steps to create a qualified or failed report template:
1. Click on the "Methods" tab, select a report, right click on the report; select "Open" to display the "Edit Report Method" window.
2. Select New in the Edit Report Method window to open the New Method/Group window.
3. Select "Create a new report method", check the "Use report method/group wizard" option; then click "OK" to open the "Report Method Template Wizard".
4. Select Single Report and click Next to open the New Method Wizard window.
5. Select "Single" in the report type and click "Finish" to display a report method template.
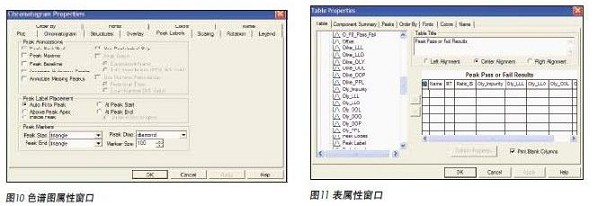
6. Right-click on the chromatogram and select Properties to open the Chromatogram Properties window (Figure 10).
7. Select "Peak Label", check "Use only peak labels", and then click "OK".
8. Right-click on the Table and select Properties to open the Table Properties window.
9. Select the Peaks tab and check Peak Groups.
10. Click on the "Tables" tab and click on the desired peak in the tree structure. Double-click each indicator peak to add the corresponding custom field to the results table, as shown in Figure 11.
11. Click "OK" and enter the name of the report template (for example, the name shown here is "Special Natural Olive Oil Quality Control Report"), then click "Save" in the toolbar.
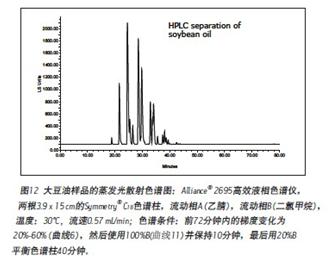
RESULTS AND DISCUSSION <br>Common high performance liquid chromatography without the use of a halogenated solvent as the mobile phase is difficult to separate the triglyceride, the main component of vegetable oils. Figure 12 is a typical chromatogram of soybean oil obtained by ordinary high performance liquid chromatography (two 5 μm particle-filled 150 mm long C18 column, evaporative light scattering detector ELSD) using acetonitrile and dichloromethane as mobile phases. It takes more than 60 minutes to achieve this separation. Since methylene chloride has ultraviolet absorption within 240 nm, this interferes with the ultraviolet absorption of the triglyceride (maximum wavelength absorption value is about 210 nm), and thus is detected using an evaporative light scattering detector (ELSD).
The ACQUITY UPLC System is designed with high-performance columns that use small particle packing technology for faster, more sensitive, and higher resolution separations. UPLC's solvent delivery system can withstand back pressures up to 15,000 psi, allowing the use of high viscosity solvents such as 2-propanol for vegetable oil analysis. Since 2-propanol has good solubility in vegetable oils, low toxicity, low transmission limit, and easy ultraviolet detection of triglycerides, 2-propanol was selected as a strong eluent. Figure 13 is a diagram showing the reproducibility of the UPLC method for 10 superimposed UV chromatograms of the same soybean oil sample using a 2.1 x 150 mm BEH C18 column with 1.7 μm particle size and acetonitrile/2-propanol as mobile phase. The overall running time was shortened to 22 minutes. Figure 12 and Figure 13 have similar triglyceride peaks, but the UPLC method has higher resolution and shorter run time. The data indicates that no carcinogenic solvent is used as the mobile phase, and the use of UPLC to separate components in vegetable oil has significant advantages. UPLC systems for acetonitrile/2-propanol mobile phase for vegetable oil analysis can use PDA, ELSD and MS detectors, unlike Other solvents used in general high performance liquid chromatography. A variety of data types can be obtained in one injection, and reproducible fingerprint data 7 can be generated, the triglyceride component 10 can be identified by mass spectrometry, and the degree of oxidation of the vegetable oil can be determined by PDA multi-wavelength scanning. Vegetable oils are currently known to have a characteristic triglyceride ratio, which is useful for the identification of vegetable oil fingerprints 5-8. As shown in Figure 14-16, walnut oil, grape seed oil, sesame oil, extra natural olive oil A, extra natural olive oil B, hazelnut oil, tea seed oil, corn oil, Canadian low acid oil, high oleic sunflower oil UV chromatograms of common sunflower oils confirmed that each oil sample has a unique chromatographic type, ie relative peak intensity. 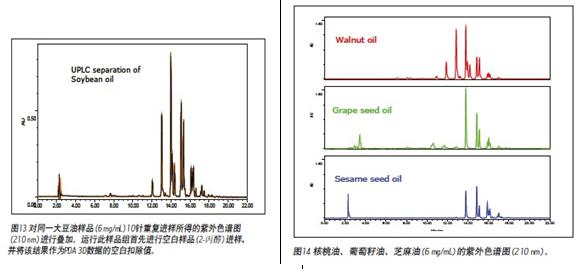


In order to efficiently use peak intensity ratio for brand quality control and quality identification, Empower 2 software's custom field calculation function automatically converts raw chromatographic data into qualified or unqualified reports according to user-set quality control standards. The modified natural olive oil A is taken as an example to illustrate the improved method. Figure 17 is a superimposed UV chromatogram and peak area of ​​premium natural olive oil A. The peak area of ​​the triglyceride is from the strongest peak (OOL) to the weakest peak (LLL), and its RSD value (n=6) is <0.9%. There are more than 20 visible peaks, and any peak can be used as a labeled peak or an indicator peak to calculate the peak area ratio. For ease of discussion, the peaks OOO, OOL, LLO, and LLL of the previously identified triglycerides were selected as the indicated peaks 10, which would only occur in olive oil products, and the strong peaks with a retention time of 9.8 minutes observed by UV detection. Selected as the marker peak 13. Since most inexpensive vegetable oils and degraded oils have many other strong peaks with retention times below 13.6 minutes, an impurity indicator peak can be created using the timing group function (Figure 7) to monitor for contamination. The impurity indicating peak refers to the sum of all peaks having a retention time other than the labeled peak of 3-13.6 minutes. By creating a custom custom field "Ratio_IS" (Figure 4), the peak area ratio (indicating the peak area divided by the labeled peak area) can be automatically calculated using the Empower 2 software. Table 1 summarizes the results of the peak area ratio and the STDEV value. "Peak area ratio ± 3xST-DEV" was used as the quality control standard for each indicated peak. There may be differences in a particular type of vegetable oil due to differences in geography and other planting conditions. This value is of great value in comparing whether other vegetable oil samples meet quality control standards based on specific oils. 
Empower 2 software now uses custom field calculations, named groups, timing groups, and report templates (shown in Figures 6, 7, 9, 10, and 11) that are automatically calculated based on the quality control criteria for premium natural olive oil A. Report the results of the sample pass or not. Figure 18 is a typical Empower quality control report for premium natural olive oil A. The report indicates that all indicator peaks meet quality control standards. These advanced features of Empower software avoid manual calculation steps and therefore avoid possible human error.
Expensive premium natural olive oil is often incorporated into cheap olive oil and other vegetable oils such as soybean oil and hazelnut oil. Figure 19 is a report of a premium natural olive oil B. All indicator peaks indicate that the premium natural olive oil B did not pass the quality control standard established according to the premium natural olive oil A. There are additional peaks in the chromatogram with retention times <13.6 min. These data clearly indicate differences between the two brands of olive oil samples and confirm that not all commercially available premium natural olive oils are of the same quality. Figure 20 is a report of a premium natural olive oil A spiked with 9% hazelnut oil. All indicator peaks indicate that the adulterated sample does not meet quality control criteria. Moreover, the same quality control standard set according to the premium natural olive oil A was also applied to the analysis of other vegetable oils (Fig. 14-16), and the special natural olive oil A also incorporating 1% soybean oil or 1% corn oil was unqualified.

Described previously is a stoichiometric method 14 for detecting adulteration of olive oil using UPLC-TOF and integrated software tools. This technical literature provides an alternative solution for vegetable oil quality control and quality identification. The method can acquire and process data completely automatically, resulting in a clear pass or fail report.
Conclusions <br>The ACQUITY UPLC System with Empower 2 software eliminates the need for derivatization and halogenated solvents and enables rapid analysis of vegetable oil samples for quality identification.
The data from the UPLC system is reproducible, accurate and accurate, and is easy to understand. The separation speed is three times faster than that of ordinary high-performance liquid chromatography, the amount of solvent consumed is reduced by 8 times, and the harmful waste generated is also reduced by 8 times; thereby saving cost and improving safety. The ACQUITY PDA Detector produces high resolution and reproducible data, which makes it easy to create fingerprint data for quality control and quality identification standards for each brand of vegetable oil. With the custom field calculation function of Empower 2 software, key product quality control data can be accurately derived from the original data and quickly transmitted according to user-set standards, effectively producing easy-to-understand qualified or unqualified reports. Decision makers can make timely decisions based on this important information to increase productivity. Using this UPLC method, vegetable oil companies can easily and confidently identify the quality and quality of their products. Other industries that are of interest to the purity of vegetable oil products, such as cosmetic companies, personal care companies, and food companies, will also benefit from this approach.
references
1. http://
2. VG Dourtoglou et al. JAOCS, Vol.80, No.3: 203-208, 2003.
3. LCGC, The Application Notebook, Sept 1, p51, 2006.
4. AJ Aubin, CB Mazza, DA Trinite, P McConvile. Analysis of Vegetable Oils by
High Performance Liquid Chromatography Using Evaporative Light Scattering
Detection and Normal Phase Eluents. Waters Corporation, No. 720002879EN,
2008.
5. P Sandra et al J Chromatogr. A 974: 231-241, 2002.
6. International Olive Oil Council standard method COI/T.20/Doc. No. 20 2001.
7. PJ Lee, CH Phoebe, AJ Di Gioia. ACQUITY UPLC Analysis of Seed Oil (Part 1):
Olive Oil Quality & Adultration. Waters Corporation, No. 720002025EN, 2007.
8. PJ Lee, CH Phoebe, AJ Di Gioia. ACQUITY UPLC Analysis of Seed Oil (Part 2)
Olive Oil Quality & Adultration. Waters Corporation, No. 720002026EN, 2007.
9. PJ Lee, and AJ Di Gioia. ACQUITY UPLC/ELS/UV: One Methodology for FFA,
FAME and TAG Analysis of Biodiesel. Waters Corporation, No. 720002155EN,
2007.
10. PJ Lee and AJ Di Gioia. Characterization of Tea Seed Oil for Quality Control
And Authentication. Waters Corporation, 720002980en, 2009.
11. Empower\help\Custom Field Calculation.
12. FO Oyedeji et al Characterization of Isopropanol Extracted Vegetable Oils. J
Applied Sci. 6: 2510-2513, 2006.
13. The marker (Oly) peak at 9.8 min was well detected by UV but had weak MS
Response with APCI positive ionization mode. According to the SQD MS spectra,
The marker peak is not a triglyceride. High resolution mass spectrometers with
Exact mass capabilities are needed in order to properly elucidate its chemical
However, it is not necessary to have peak identification for this QC
And authentication methodology.
14. P Silcock and D Uria. Characterization and Detection of Olive Oil Adulterations
Using Chemometrics. Waters Corporation No. 720002786en, 2008.
FUXIBIO FFP2 Respirator manufactured by Careable Biotechnology Co.,Ltd
- High filtration Efficiency
- In Chinese PPE Export Whitelist
- CE Certification issued by AENOR NB0099
- Low Breathing Resistance: Flow Rate≥95 L/Min
- Real FFP2 Standard: Test agent in (≤3μm) DOP, Penetration≤6%
- ISO9001 Quality Management System Certificate
Ffp2 Respirator Cup Shape, Ffp2 Face Mask,Ffp2 3D Mask,Ffp2 Mask Online
CAREABLE BIOTECHNOLOGY CO,. LTD , https://www.careablemask.com